Chipotle put buyers spend $8 million as volume hits 8x average
Put trading reached eight times the monthly average ahead of the restaurant chain's quarterly report.
By Nadia Almasi ·
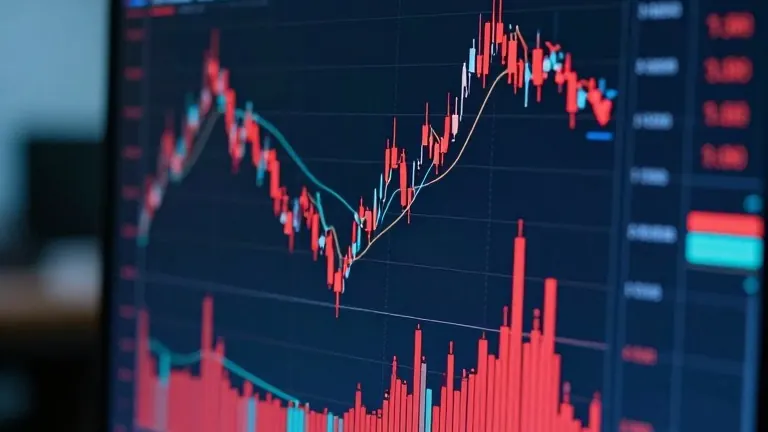
Chipotle options activity surged on Tuesday, with total volume exceeding eight times the stock's monthly average. The trading flow skewed heavily toward bearish positions, signaling strong caution among market participants ahead of the company's earnings release.
Traders executed approximately 240,000 put contracts during the session. This volume dwarfed the activity on the call side, where fewer than 17,000 contracts changed hands. The premium for these bearish bets totaled roughly $8 million.
A specific trade indicated a shift in strategy for one large participant. Around 11:30 a.m. Eastern, a trader bought back 56,000 puts with a $25 strike price expiring on Nov. 6. This action suggests the trader had previously sold those contracts and is now closing the position.
Simultaneously, the same trader sold 56,000 puts with a $22.50 strike price expiring in mid-December. This move, known as a roll, extends the expiration date and lowers the strike price. It implies the trader expects the stock to decline further or remain under pressure for a longer period.
Another distinct bet highlighted the bearish sentiment. A separate trader purchased 7,500 puts with a $28 strike price expiring on Nov. 20. The cost of this position was $1.1 million. The trade profits only if Chipotle shares drop another 5% over the next three and a half weeks.
Jason DeLorenzo, founder and owner of the options positioning platform Volland, noted that the data showed customers were generally bearish. He described the moves as earnings plays. DeLorenzo also pointed to the low implied volatility, noting that the last time pre-earnings expectations were this low was in July 2025, a period when the stock suffered a sharp decline.
Technical analysts are watching the $27 price level closely. This figure marks the shoulder line of a head and shoulders pattern that has been in place since January 2021. A break below this line is typically interpreted as a bearish signal by chart watchers.
Source: CNBC
More Business · National news · Unethical Practices · Report a business · Got a Story?